Last Sunday, I was sitting on my back deck drinking my coffee and going through candlestick charts, as one does. I was looking for secular changes in the market. In finance, "secular" refers to changes that happen over a long period of time.
For example, for the past 10 years, we’ve been in a secular bull market for large-cap tech but a bear market for commodities.
So I was shocked when I pulled up this chart. Each candlestick represents three months, or a quarter.
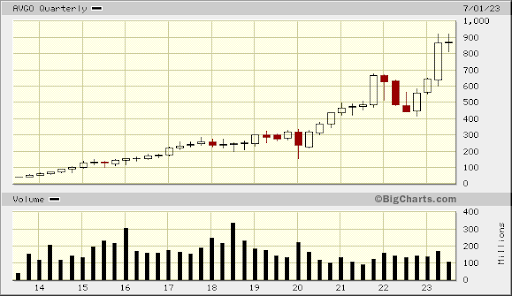
That’s Broadcom, which is a market leader in AI chips. That cross-looking candlestick on the right is known as a doji. Our analysts have traveled the world over, dedicated to finding the best and most profitable investments in the global energy markets. All you have to do to join our Energy and Capital investment community is sign up for the daily newsletter below.The Best Free Investment You’ll Ever Make
Then I opened this Microsoft chart:
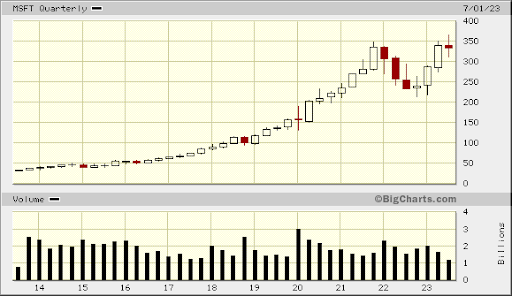
Another doji.
And then there was this Netflix one:

And the list went on. The majority of our market leaders have this candlestick formation on the long-term chart — and it shocked me because a doji is a turnaround signal.
First, a little history…
Dojis are a candlestick chart pattern that was developed more than 1,000 years ago by traders on the Japanese rice markets, and they are powerful reversal signals.
A candlestick is a visual representation of a trading session. You have an open, a close, a high price, and a low price.
If the candlestick is white, it means that the price closed higher than it was when the market opened.
If it is red, the price ended the day lower than it started.
The vertical legs are the highs and lows. Doji candlesticks are black because they closed at or near where they opened.
In other words, dojis are formed when the candlestick opens and closes at the same level, implying the fight between the bulls and the bears is at loggerheads. Dojis signal turning points. They are formed when a stock runs out of buyers.
Dojis come in four types:
- Standard doji — This candlestick looks like a cross, inverted cross, or plus sign. At the top of a trend, it can indicate a reversal is near.
- Long-legged doji — Long-legged doji formations occur when the stock opens at certain levels, trades in a wide trading range intraday, and closes at the same level that it opened. These become better predictors when preceded by small candlesticks. Long-legged doji formations can imply a change in trend.
- Dragonfly doji — The bearish dragonfly doji can usually be found at the market top or during an uptrend. This candlestick tells us the bulls may be losing their way, and it casts doubt on the market's ability to continue north. Confirmation is essential. You can confirm with a gap down or a lower close on the following day.
- Gravestone doji — Gravestones are the opposite of dragonflies. These dojis look like gravestones and can signal the death of a stock.
Oracle Misses
Now, to come out bearish on Microsoft (NASDAQ: MSFT) is pretty much a heresy after the share price has gone up 1,000% in the past 10 years. The difference is that in 2013, MSFT had a P/E of 10 and a 3.5% dividend. It now has a P/E of 35 and a dividend of 0.80%.
It’s not overvalued if it can continue to grow at 30% a year, but its main driver of growth has been its cloud business. And today, competitor Oracle (NYSE: ORCL) dropped 13% as it reported lower demand in cloud spending.
And on the artificial intelligence (AI) side, Yahoo Finance tells us it's not living up to the hype:
August marked the third month in a row that the number of monthly visits to ChatGPT's website worldwide was down, according to data from analytics firm Similarweb.
And the average time spent on OpenAI's chatbot has been declining every month since March, from 8.7 minutes to 7 minutes in August, per Similarweb data shared by Reuters.
Although Similarweb reports that while the total number of visits declined by around 10% in June and July, that leveled off a bit in August, with a decline of 3%. In the U.S. alone, visits to the ChatGPT website increased by 0.4% in August.
If you own any of the three stocks I listed above, you might consider selling some shares. If you don’t, you should wait to buy them on the dip. The bad news is that five large tech names now represent 23% of the S&P 500. If they sell off, just about everything is going to head lower.
It’s time to sell tech and buy oil.
All the best,
Christian DeHaemer Christian is the founder of Bull and Bust Report and an editor at Energy and Capital. For more on Christian, see his editor’s page.