A MESSAGE FROM THE PUBLISHER

The gold/silver ratio peaked this week at 128.79, its highest level in the ratio’s 4,000-year history.
Today, we examine what that means for precious metal investors.
But first, let me briefly describe what we’re talking about for those who don’t know.
Gold/Silver Ratio since 1970
What Is the Gold/Silver Ratio?
The gold/silver ratio (sometimes “gold-to-silver ratio”) is pretty much as advertised: It’s just the exchange rate between gold and silver.
Today, the ratio is simply calculated by dividing current gold and silver prices. Gold closed yesterday’s trading day at $1,472.46 an ounce and silver at $12.08 an ounce. So, at the close of the market yesterday, the gold/silver ratio was 121.89.
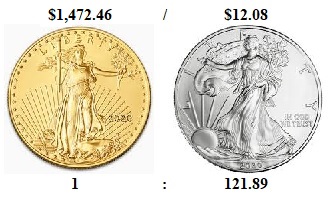
The ratio is typically expressed as a single figure (as in the chart above), giving the number of silver ounces required to purchase one ounce of gold at any given time.

On Tuesday, the gold-to-silver ratio reached a daily high of 128.79. That’s unusually high.
See, The gold-to-silver ratio is one of the oldest exchange rates in history. Both gold and silver have been highly valued as ornamental metals and used as money for thousands of years. As such, an exchange rate between the two metals was needed. And one has been around for just as long.
Some of the earliest examples of humans comparing the relative values of gold and silver are found on ancient Egyptian temple walls — with some dating back as far as 4,000 years ago.
Inscriptions found at the Karnak Temple Complex (constructed between 2000 B.C. and 30 B.C.), for example, list tribute demands from subject nations setting the gold/silver ratio at 13.33 to one.
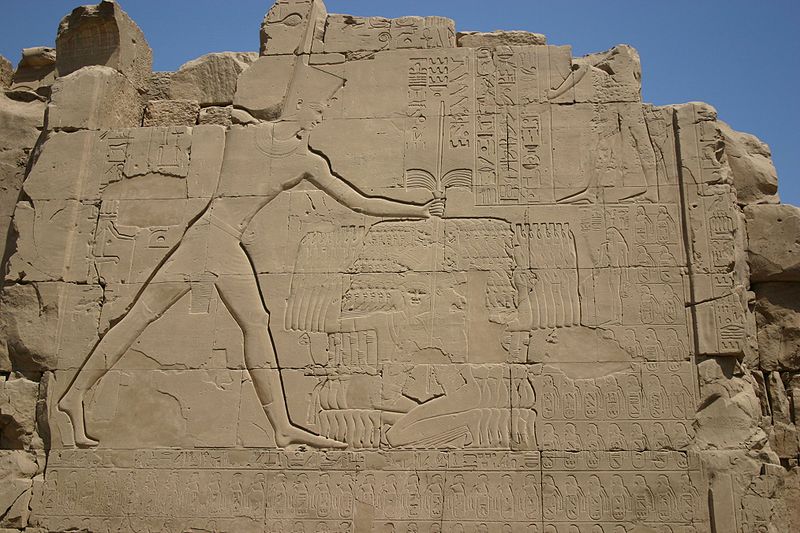 Thutmose III’s (1479–1425 BC) Battle of Megiddo Inscription at Karnak Temple Complex in Luxor, Egypt. Depicts the pharaoh’s conquering the Canaanites and money gained through campaigning, tributes, and offerings.
Fast forward through the time of the ancient Greeks, Persians, and Romans… through the Industrial Revolution and Victorian era… that ratio stayed approximately the same.
Several sources show us that for most of human history… from the ancient Egyptians to about the time of our great-great-grandfathers… the gold-to-silver ratio ranged between 10 to 18 and one.

Gold/Silver Ratio 1700 to Present

There are a few reasons it’s believed rulers and policymakers kept the gold-to-silver ratio in this 10 to 18 range.
The Best Free Investment You’ll Ever Make
Our analysts have traveled the world over, dedicated to finding the best and most profitable investments in the global energy markets. All you have to do to join our Energy and Capital investment community is sign up for the daily newsletter below.
Some say the ratio was inspired by cosmic movements and the position of the sun and moon, which were believed to be extraterrestrial counterparts of gold and silver, respectively.
A more popular explanation for the 10 to 18 ratio, however, concerns the relative supplies of each metal. Some thought silver to be 10 to 18 times more abundant in nature, inspiring the numbers for the ratios. That may be true, but a recent analysis of the Earth’s crust estimates silver being more common than that, with estimates ranging from 18 to 63 times more abundant than gold.
Either way, historical gold/silver price ratios and their origins are interesting (IMO), but they’re not relevant to investors today.
Firstly, there is no standardized system that’s been continuously tracking the gold-to-silver ratio for thousands of years. The historical gold/silver ratio is a mostly incomplete patchwork of gold and silver’s past relative values. What we know of the historical ratios is taken from multiple sources from different parts of the world and time.
Moreover, historical gold/silver ratios were set by individual rulers, kings, presidents, and governments for monetary purposes. Today, we don’t use gold or silver as money. So the market for metals has completely changed.
In short, the historic gold/silver ratio is really of little use to us as investors.
Since the end of Bretton Woods in the 1970s, however, gold and silver have been able to trade freely against each other in an open, global market 24 hours a day. This gives us a better picture of gold and silver’s relative value in a globalized world.
Since then, the gold-to-silver ratio has moved between 20 and 100, averaging about 60. The highest monthly gold/silver ratio was previously set in January 1991 amid an eight-month U.S. recession. The gold/silver ratio averaged 99.47 for the month.
Gold/Silver Ratio 1970 to Present
So, forget the historic ratio, at over 120 right now, the gold/silver ratio is still noticeably high relative to the past few decades.
What does that mean for investors?
Unfortunately, not much.
The only thing we can say for certain is that over the past few decades a gold-to-silver price ratio over 80 wasn’t sustainable for long. And that a correction is probably forthcoming. But does a correction in the gold/silver ratio mean the price of silver is set to head higher? Or does it mean the price of gold will decline?
Unfortunately, the gold/silver ratio doesn’t answer these questions. It only asks them.
Following the gold/silver ratio’s previous peak in the early 1990s, both metals, but especially gold, ended up declining in price.
| Gold 1990 to 2000 | Silver 1990 to 2000 |
|
|
|


The fact is, it relates to gold and silver as precious metals. But in the modern world, they are very different commodities with different supply and demand dynamics.
On the supply side, gold can be mined as a primary material, for example, whereas silver is typically mined as a byproduct. And in-demand gold is primarily a monetary asset with over 90% of its end use going into jewelry or investment. Meanwhile, silver is mostly an industrial metal, with less than half of its end use going into jewelry or investment.
It relates to gold and silver, but they’re not twins. We could make up ratios for any two related products — the apples-to-oranges ratio, for example. But this really wouldn’t show us anything other than an unusual difference in current prices. And that’s about the best the gold/silver ratio can give us.
The gold/silver ratio is just a number that shows us when gold and silver’s price differences are unusual. It’s not a good leading indicator for anything and only just gives us more questions than answers.
Until next time,
Luke Burgess
As an editor at Energy and Capital, Luke’s analysis and market research reach hundreds of thousands of investors every day. Luke is also a contributing editor of Angel Publishing’s Bull and Bust Report newsletter. There, he helps investors in leveraging the future supply-demand imbalance that he believes could be key to a cyclical upswing in the hard asset markets. For more on Luke, go to his editor’s page.