About four months ago on December 7, 2021, I told you that the markets were heading lower and to sell the rips not buy the dips. This is what I wrote:
This is the most ominous chart I’ve seen in years:
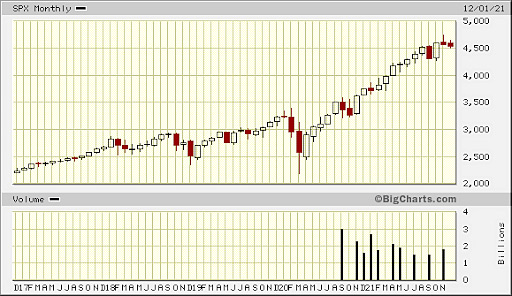
This is a five-year, monthly candlestick chart of the SPX. The SPX is based on the 500 top companies in the United States.
Each candlestick represents a month. The chart goes back to 2017.
That red candlestick from two months ago (October) that looks like an upside down hammer is called a “gravestone doji.”
Japanese Rice Traders
Candlestick charts go back 1,000 years to rice traders in Japan. A green candlestick means the asset price closed higher than it opened. Red means the market closed lower than it opened.
The thin line or tail represents the highs and lows during the session.
Here is the gravestone doji diagram:
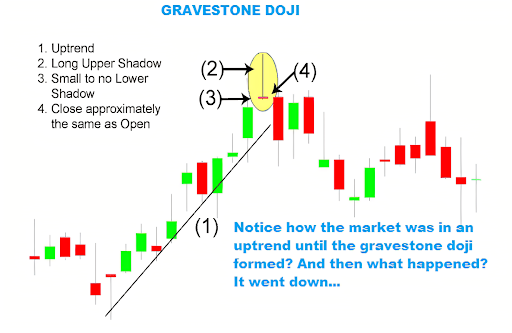
What this means is that the buyers took the market up at the start of the month but then the sellers overwhelmed them. It closed where it opened.
It means that the buyers are done. There are no more buyers. This is also called a blowoff top.
When this comes after a long bullish market where everything is overvalued, it is bad news. You’ll notice the last one in the first chart came in January of 2020 when COVID hit and the SPX sold off about 1,000 points.
When I first started trading, a salty veteran referred to this as “flags planted on the top of a mountain,” like Hillary and Norgay on the peak of Everest.
Sometimes a gravestone doji doesn’t mean very much. The market consolidates and goes on. But there is a lot of air under this market. The market cap to GDP is the highest it has ever been. Inflation is running well above the Fed’s target rate of 2% and rate hikes are back on the menu.
We are 12 years into this heated bull market. A 700 to 1,000 point drop on the S&P 500 could happen over the next few months.
Our analysts have traveled the world over, dedicated to finding the best and most profitable investments in the global energy markets. All you have to do to join our Energy and Capital investment community is sign up for the daily newsletter below.
Nailed It
I was correct in my call. The SPX sold off 762 points.
That said, time waits for no man. Here is the market this week.
This is a six-month, daily chart of the S&P 500. As you can see, we are going down and retesting that double bottom at 4,200. That is a major support level. If you are a trader you would buy call options. I like the May 2022 4,290.00 SPX calls, which are trading at $31.05.
If the market bounces and we make back half the sell off — which seems likely — you’d be in the money by next week.
After that I expect this market will be in a trading range until there is a discernible trend or valuations work themselves to a more reasonable number. The current P/E ratio is 21.35 on the S&P 500. The mean P/E ratio over its 150-year history is 15.97. The post-great financial crisis low in 2012 was around 14.80.
If earnings hold up for the next two quarters, the market will go up on value expansion alone. Granted, that’s a big “if.”
The upshot is that at this point there is no discernible trend, so as an investor it’s difficult to make a move. If you are a trader, however, you can make a lot of money playing a range-bound market. My good friend Sean has a trading service called Naked Trades that does just that using options. Give it a shot here.
Christian DeHaemer Christian is the founder of Bull and Bust Report and an editor at Energy and Capital. For more on Christian, see his editor’s page.