Back in 2004, I refinanced my house to take advantage of lower mortgage rates. It just so happened that there was a mortgage broker in my neighborhood, as well as a real estate appraiser.
My wife at the time wanted to update our kitchen and the basement and add all the gewgaws and widgets that go along with it.
Fine.
We went to the mortgage broker, refinanced, and took out some equity. He went to the real estate appraiser and said, “I need XX amount to make this deal happen… and Fred, if you want more work from me — this deal is going to happen.”
Fred said, “Sure, I can do that.”
Some people might say that it is a conflict of interest for Fred to be appraising housing prices in his own neighborhood, or for our mortgage broker to give him work based on that appraisal. But that’s how the world works, and it is part of the reason housing prices climbed beyond all rationality.
Rating Agencies
There are also rating agencies that produce judgments on sovereign and corporate debt. The top three are Moody’s, S&P, and Fitch. Personally, I think they all suck. Here’s why…
I’ve been in this business for 20 years and lived through five major international meltdowns, and these debt ratings agencies have never given prior warning. They are, in fact, less than worthless because a “AAA” rating absolves fund managers of the responsibility of doing the right thing.
Anyone with even a passing interest in Wall Street knows this.
But what these agencies are good at is closing the barn door after the horse gets out and the roof has fallen in.
Currently the U.S. sovereign debt is rated at Aaa, or excellent. One below the best: AAA, or outstanding.
This week in the news, Puerto Rico missed payment on its debt.
Caribbean News Now reports:
There is clear and compelling evidence of massive municipal bond fraud on the part of S&P, Moody’s and Fitch. The Puerto Rico financial collapse spurred a number of senatorial hearings in Puerto Rico. In these hearings there was direct sworn testimony from municipal agency executives that the rating agencies knew they were bankrupt but for the right fee would issue a good credit rating for their bonds.
Subsequent accounting audits of the bond issues verified that the entities were technically bankrupt when S&P, Fitch and Moody’s issued good credit ratings to them. $56 billion of the $70 billion in bond debt issued is held by Americans in the 50 states.
Rating agencies offer no protection. But the thing is that Puerto Rico has a debt-to-GDP of just 68%, or $80 billion.
The Federal Government is Far Worse…
The U.S. debt clock has surpassed $19 trillion (up from $10 trillion in 2008). That’s $161k per taxpayer. I’ve read some numbers that say if you take into account the total amount of personal debt and unfunded liabilities such as Social Security, the U.S. is leveraged to more than 350% of GDP.
But let’s push those skeletons back into a closet for another day and just look at the numbers published by the government.
Here is the chart for U.S. debt as a percent of GDP:
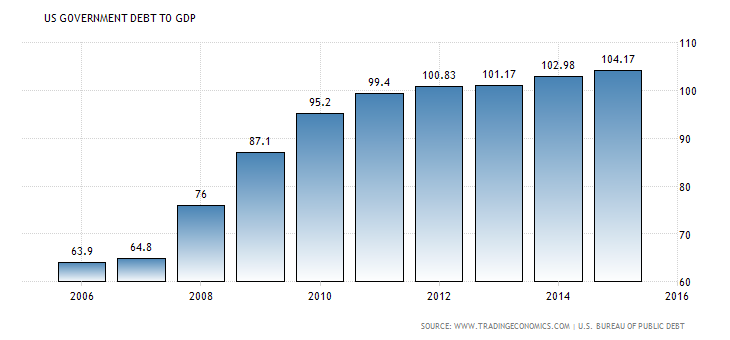
That chart can expand. In Japan, debt to GDP is 229% — up from 161% in 2012.
But then again, the Japanese stock market is at 16,000, down from 20,000 last August and 40,000 in 1990.
The U.S. is in the enviable position of having the world’s reserve currency and the currency of choice for safety.
Which means when countries like Venezuela blow up or China starts cracking down on fraud, all of the money heads for the short-term U.S. debt. This keeps our interest low and our debt payments manageable.
This is nothing more than tradition these days. It works because it has worked.
There will come a day when the dollar will no longer be seen as a safe haven.
The 10-Year Dollar Chart: There is Room to Fall…

But enough on that…
Here’s the chart you should see: The S&P 500 Two-Year Chart.

As you can tell, the S&P 500 is at a crossroads… a juncture… a tipping point…
The unmovable object of the two-year topping pattern has run into the unstoppable force of this year’s sucker’s rally.
Technical analysis guys would say that we are heading back to test that low near 1,810.
The dividend yield would tell value investors that we are at 2.14% — that’s below Black Tuesday in 1929 or Black Monday in 1987. The median is 4.39%. It’s another sign that equities are overpriced.
Momentum traders are waiting for a trend.
Our analysts have traveled the world over, dedicated to finding the best and most profitable investments in the global energy markets. All you have to do to join our Energy and Capital investment community is sign up for the daily newsletter below.
And take a look at this last chart: Gold Six-Month.

Gold is riding a six-month uptrend after going down for five years.
At this point, you want to lighten up on your equities and start thinking about buying commodities on the dips.
Interestingly, 10 of my top 30 stocks that show up on my value screens are oil companies. I’ll tell you more about that next week.
All the best,

Christian DeHaemer
Christian is the founder of Bull and Bust Report and an editor at Energy and Capital. For more on Christian, see his editor’s page.